Home›Blog›Pharma Has a Dashboard Problem
Pharma Has a Dashboard Problem
By Vladimir Simeonov
Most commercial teams don't lack reporting. They have more of it than they can use — and building another dashboard rarely fixes what's actually broken.
When something isn't working in commercial execution, the reflex is familiar: build a dashboard. Sales are soft in a region — build a view. Nobody can see brand performance clearly — build a view. A new question comes up in a leadership meeting — build a view. Each decision is reasonable on its own. The result, after a few years, is a commercial team surrounded by dashboards and not obviously better at execution because of it.
This is worth saying plainly, because the usual diagnosis is backwards. The problem in most pharma commercial organisations is not a shortage of reporting. It is a surplus of it — and a quiet misunderstanding of what a dashboard can and cannot do.
The dashboard reflex
Every visibility gap gets answered the same way: with another report. Over time a library accumulates — regional views, brand views, chain views, target-tracking views, each built for a question that mattered at the time. Individually they were all justified. Collectively they are a liability.
The proliferation itself becomes a cost. More places to look. More to maintain. More numbers that nearly agree but not quite. The act of building a dashboard feels like progress — something was produced, a gap was addressed — but the gap usually wasn't a missing report. It was a decision that wasn't getting made, and a new report rarely makes it.
A dashboard describes; it does not decide
Here is the fundamental limit. A dashboard's job is to show what happened. It is a mirror, not a map. It can show the state of a territory with complete accuracy and still leave the hardest part — what to do about it — entirely to whoever is looking.
For an analyst, that is exactly right; interpretation is their job. For a representative with a full calendar or a manager covering a dozen territories, "here is the data, now work out what it means and what to do" is precisely the step that doesn't happen. The dashboard hands off at the moment of greatest difficulty. It answers "how are we doing?" and goes quiet on "so what should I do?" — which is the only question that changes anything in the field.
The dashboard waits to be visited
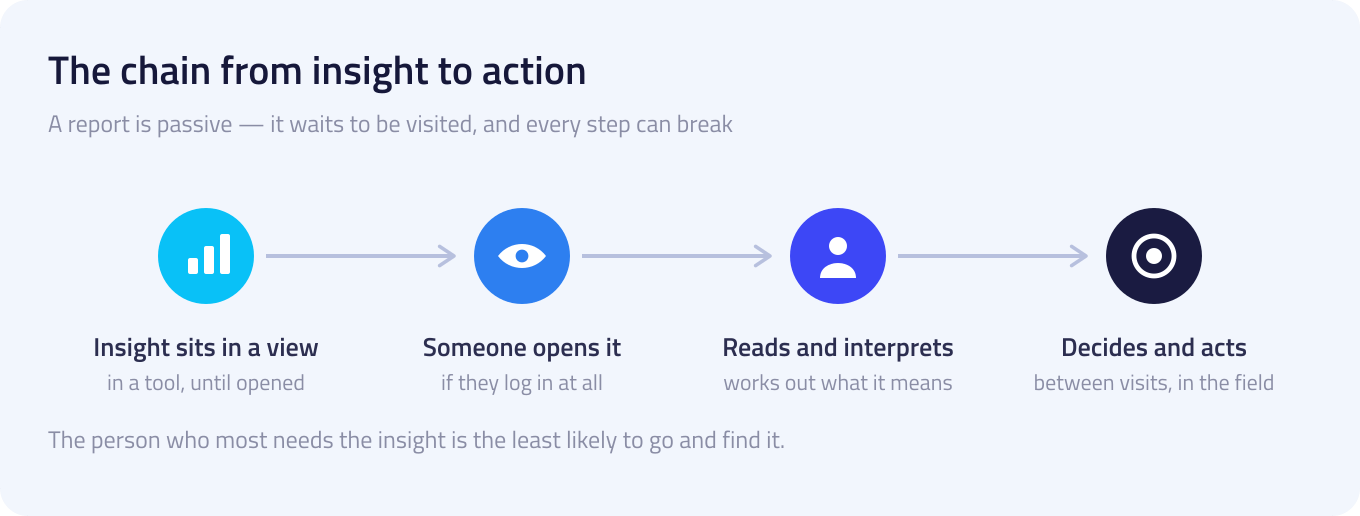
A report is also passive. It sits in a tool until someone opens it, reads it, interprets it, and decides to act. Every one of those steps is a point where the chain can break, and in practice it breaks often.
The person who most needs the insight is the least likely to go and find it. A representative between visits is not going to log into a BI platform, navigate to the right view, and reverse-engineer their priorities for the afternoon. So the dashboard ends up busiest with the people who need it least — analysts and head-office teams who live in the data — and largely ignored by the field, who have the least time to dig and the most to gain from the answer. The insight exists; it just never travels to where the decision is made.
More dashboards make this worse, not better
Adding views does not divide the problem; it multiplies it. Ten dashboards do not give ten times the clarity. They give ten places the truth might be and ten opportunities for those places to disagree.
That last point is the quiet killer. When two dashboards show slightly different numbers for the same thing — built on different refresh cycles, different definitions, different filters — trust in all of them erodes. "Which number is right?" becomes its own recurring time sink, and the safest response becomes to trust none of them and fall back on instinct. A surplus of reporting can leave a team less confident than a single clear source would, not more. Beyond a certain point, each new dashboard subtracts.
What actually changes execution
The fix is not another dashboard. It is a change in what the tool is for.
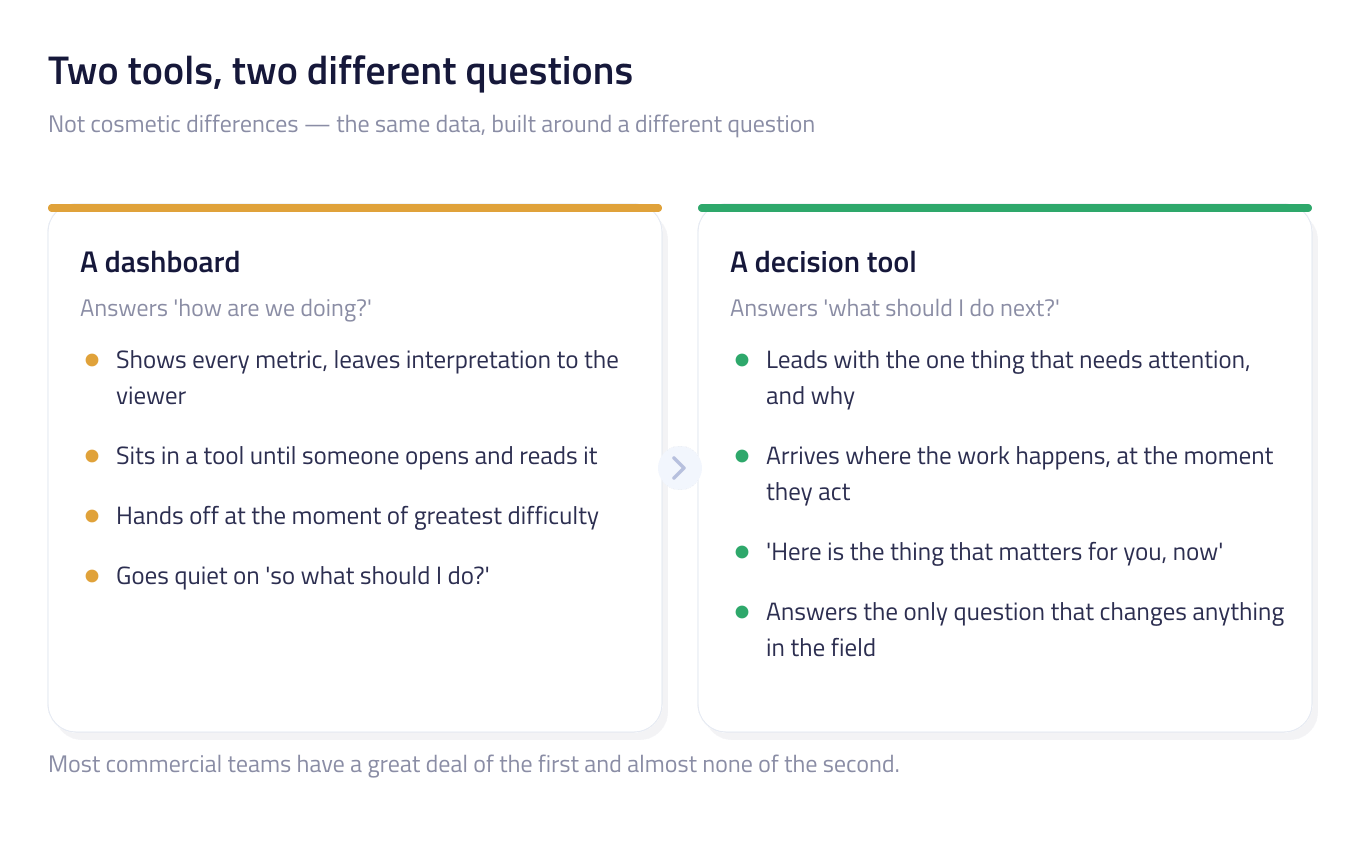
From describing the state to surfacing the decision: instead of showing every metric and leaving the interpretation to the viewer, lead with the one thing that needs attention and why. From waiting to be visited to arriving where the work happens: bring the relevant insight to the person at the moment they act, rather than expecting them to come looking. From "here is everything" to "here is the thing that matters for you, now."
These are not cosmetic differences. A dashboard that answers "how are we doing?" and a tool that answers "what should I do next?" are genuinely different artifacts, built around different questions. Most commercial teams have a great deal of the first and almost none of the second, and then wonder why more of the first changes so little.
Reporting still matters — it is just a different job
None of this means dashboards are useless. They have a real and permanent role: the considered look back. Trend analysis, board reviews, audit, period comparisons, the kind of analysis that should be done slowly and deliberately at a desk. For that work, a good dashboard is the right tool, and accuracy matters more than immediacy.
The mistake is expecting that same artifact to also drive daily field execution. The considered review and the in-the-moment decision are two different jobs, and one tool cannot do both well. The review wants completeness; the decision wants focus. Keep the dashboard for the review it is good at — and give the field something shaped like an action, not a report.
Conclusion
The instinct to "build a dashboard" treats a decision problem as a display problem. But more display does not produce more decisions, and a team can drown in accurate reporting while execution quietly drifts. Pharma's commercial challenge is rarely a reporting shortage. It is a surplus of description sitting alongside a deficit of direction — and you do not close a direction gap by adding another thing to look at.
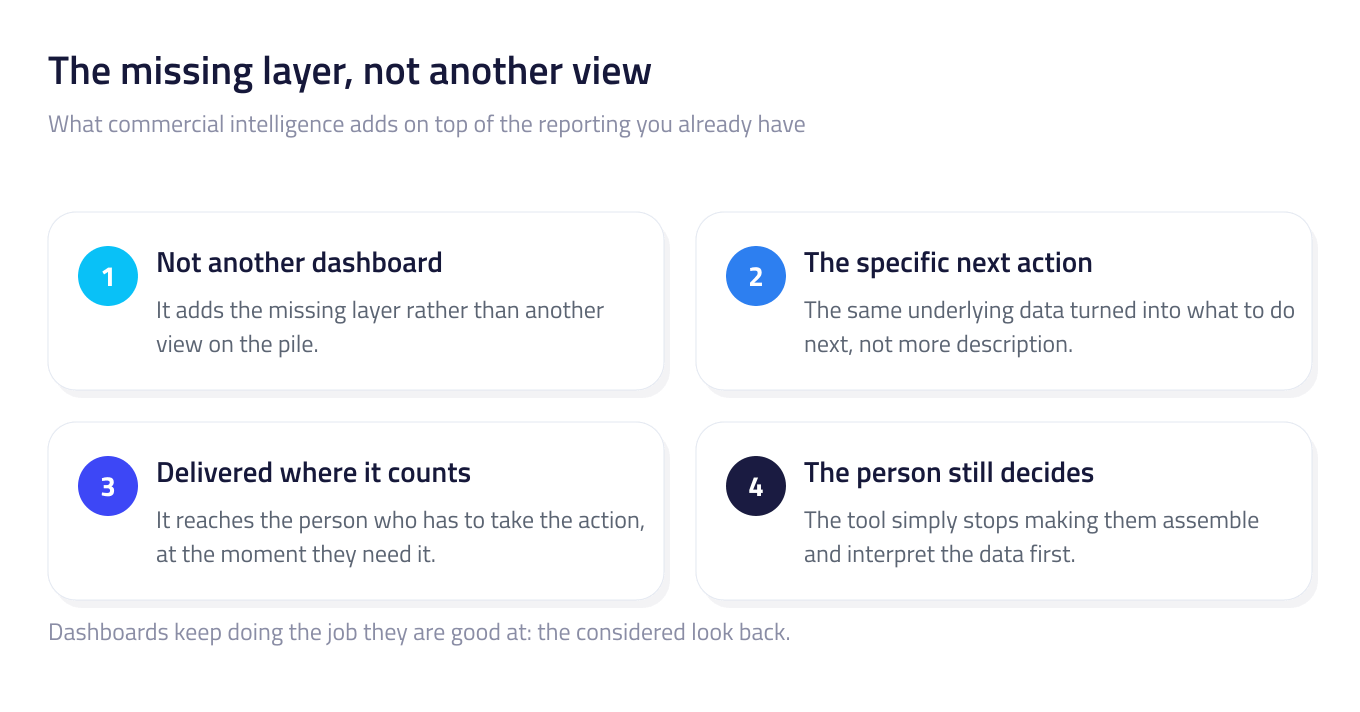
This is the distinction commercial intelligence is built around. Pharmalyze.AI is not another dashboard to add to the pile; it adds the missing layer — turning the same underlying data into the specific next action, and delivering it to the person who has to take it, at the moment they need it, rather than leaving it in a view they have to find and interpret. The dashboards keep doing the job they are good at. The decision finally gets made where it counts. The person still decides; the tool simply stops making them assemble and interpret the data first.